Infographics to Develop Business Acumen


Robin Helweg-Larsen
Published Date
This week's edition of The Economist features an intriguing review of three books on infographics ("Winds of Change"). The article opens with a mention of William Playfair, the Scottish engineer who invented the bar chart, pie chart, and line graph—the foundation of modern data visualization.
It also highlights Google’s recent “Wind Map”, describing it as:
"A unique way to show near real-time data in a way that is both informative and elegant."
That’s a great definition of what makes an infographic successful. A truly effective visualization combines education and artistry, engaging both the eye and the mind.
A Classic Example: Napoleon’s Russian Campaign
One of the greatest infographics of all time is Minard’s 1869 flow map of Napoleon’s disastrous Russian campaign. It visually represents:
- Longitude, latitude, and direction of travel
- Key dates in the invasion
- The shrinking size of Napoleon’s army
- Temperature drops during the retreat
This almost wordless visualization tells the story of an epic military disaster better than raw numbers ever could. It doesn’t replace War and Peace, but it contextualizes the data, offering a sense of scale and relationship that mere words cannot convey.
Applying This to Corporate Finance
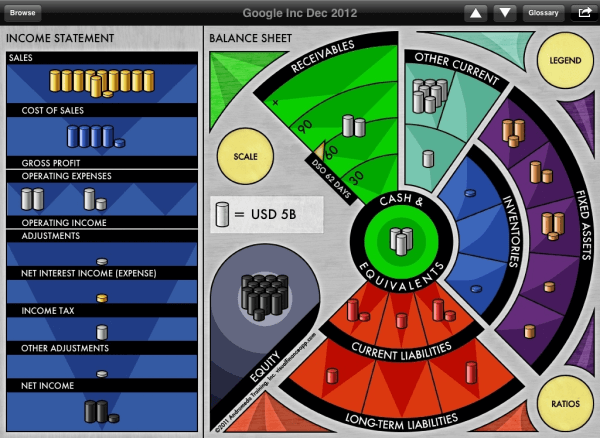
At Andromeda, we strive for that same powerful combination of information and visual artistry when we represent corporate financials—whether on the Company Board or in our iPad app.
Take General Motors' 2007 financial results—just a year before they declared bankruptcy:
Even after publicly reporting massive losses and negative equity, GM shares were still trading at around $37 per share.
If investors had seen a clear financial infographic of their results, would they have still put money into the company?
Visual Finance: See What the Numbers Are Saying
This GM visualization is featured in the free download of our Visual Finance app.
Update Jan 2025: Visual Finance app is available online at VisualFinanceWeb.com. Or start by reading more about Visual Finance.