Return on Sales (ROS): How to Measure and Improve Profitability

Eliza Helweg-Larsen
Published Date
Return on Sales: Measuring Profitability and Performance
Return On Sales, often abbreviated as ROS, is a fundamental financial metric that sheds light on a company's profitability. It’s important because it reflects a company’s efficiency in converting sales into profits.
How to Calculate Return on Sales
ROS is calculated by dividing the company's Profit (Net Income) by its total Sales and then multiplying the result by 100 to get a percentage. In simpler terms, ROS represents profit as a percentage of sales revenue.
Net Income is the profit that remains after all expenses, including taxes and interest have been accounted for.
Look at the 2023 results for Apple Inc.
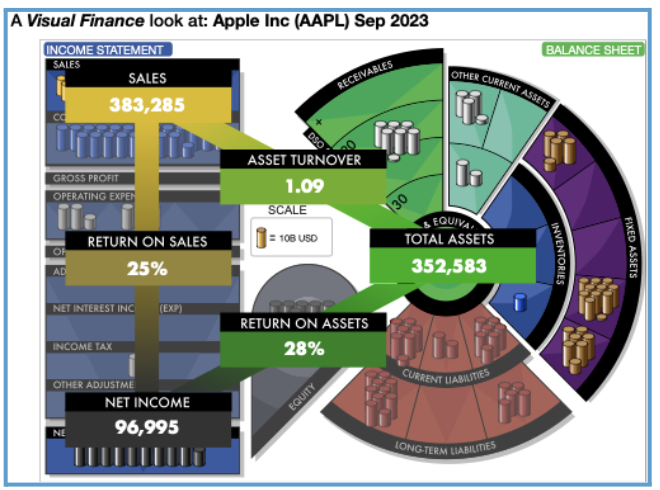
Divide the Net Income(96,995) by Sales (383,285) and multiply by 100 (to express it as a %). For Apple’s 2023 Results, Return On Sales is 25%.
This means for every dollar Apple made in sales revenue, they kept $0.25 as profit.
(This visual ratio analysis is from our Visual Finance app. If you are interested in learning more about the app, you can watch our visual finance app tour or register for free access to the app.)
What Is a Good Return on Sales?
A high Return On Sales percentage, like the 25% achieved by Apple in September 2023, indicates strong profitability. Most companies typically aim for a Return On Sales of 5-10%, though benchmarks vary by industry. This makes Apple's 2023 performance particularly noteworthy.
Other companies with noteworthy ROS: In 2023 Google had ROS of 24%, Facebook was 29%, and Microsoft 2023 was a whopping 36%!
What Is a Negative Return on Sales?
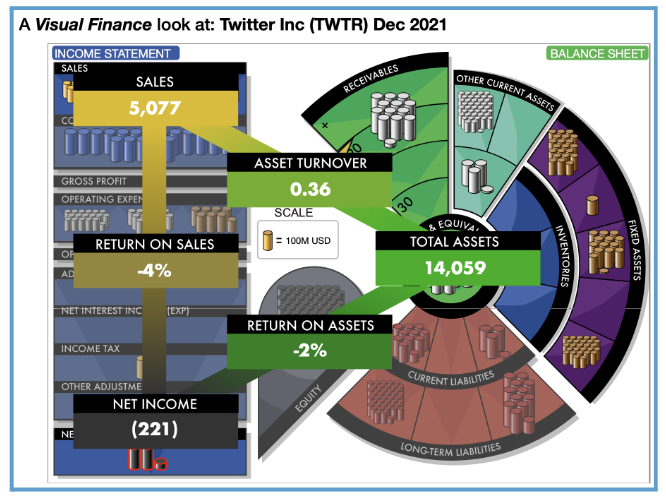
In the other direction: 2021 is the last year for Twitter being publicly traded, and they had a negative Return On Sales (-4%).
Twitter had a loss in 2021 so the Return on Sales was also negative.
If you’re unprofitable and losing money, your bottom line will be a negative number and you will have a negative Return On Sales.
Negative Net Income and ROS signifies that a company is operating at a loss (expenses exceed sales revenue); but it does not tell the whole story. If your Gross Margin is positive, increasing sales volume could potentially turn the situation around by covering fixed costs and leading to profitability.
Twitter actually had a positive Gross Profit (or Gross Margin) in 2021.
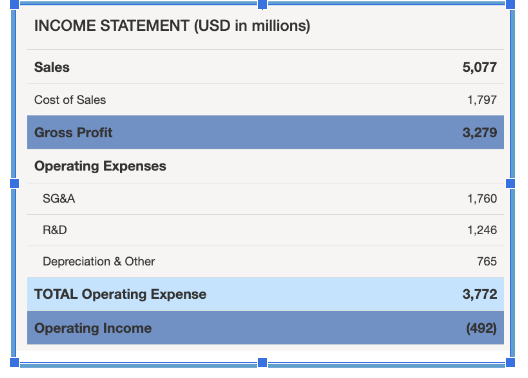
However, the Operating Expenses were significant, and the Operating Income was negative. (So was the Net Income at the bottom of the Income Statement!).
In general, businesses need to carefully manage expenses and revenue streams to achieve sustainable profitability.
THE TRIANGLE OF RATIOS
It's important to note that Return On Sales is a single metric. It doesn't provide a complete picture but it does serve as a key component in evaluating overall financial health, especially when considered alongside other metrics such as Asset Turnover and Return On Assets.
These three ratios work together as a triangle, but you must understand each individual term to make sense of the relationship.
👉 A company with a lower ROS can still achieve strong ROA if it turns over assets more efficiently, while a high ROS with low Asset Turnover may signal under-utilized assets. The key is finding the right balance between profitability and efficiency.
Income|Outcome: The Triangle of Ratios
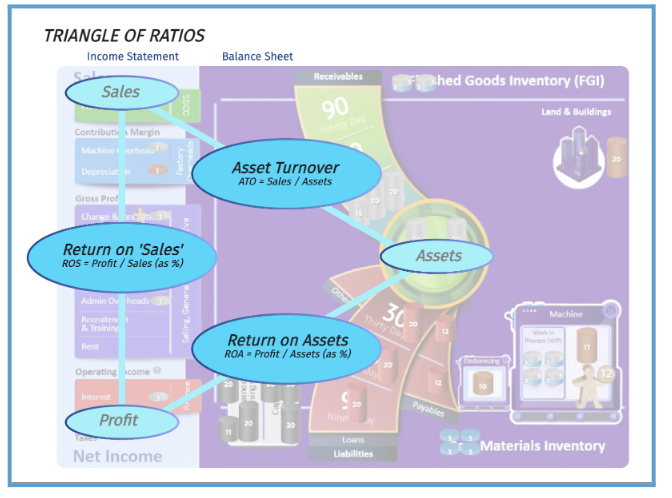
Looking at the Income|Outcome business simulation game board, you can see that the Triangle of Ratios actually connects the Income Statement and the Balance Sheet – you need both financial statements for the ‘big picture’.
Want to Apply This to Your Business?
Understanding Return on Sales (ROS) is one thing—seeing how it works in your business is another.
Continue the Learning with our hands-on guide:
- Calculate ROS for your company (and a competitor!).
- Compare to industry benchmarks.
- Identify actions to improve profitability.
👉 Try the ROS Analysis Exercise Here
This post was originally published in 2015 and was updated in 2024 to reflect new insights.