CTL: Return On Sales

Eliza Helweg-Larsen
Published Date
NOTE: This post was written in March 2025 as a follow-up to our post on Return on Sales which was originally published in 2015 and updated in 2024. We've placed it alongside the original post for easier reference.
Using Return on Sales to Look at A Real-World Company
Return on Sales (ROS) is a financial metric that measures a company's operational efficiency by calculating the percentage of revenue that is converted into profit. It is calculated by dividing Profit (Net Income) by Net Sales.
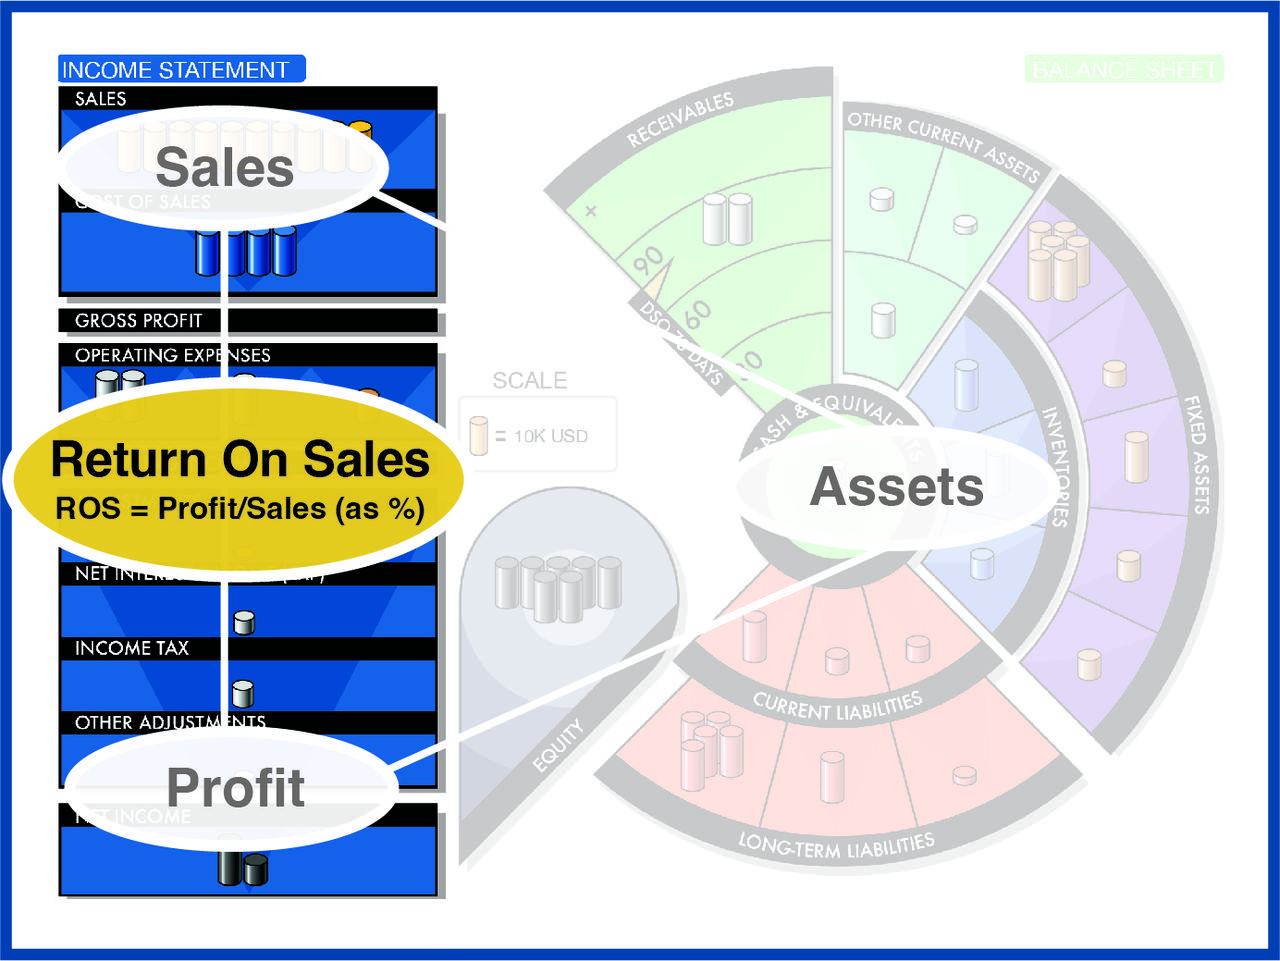
A higher ROS indicates that a company is more effective at converting sales into actual profit, reflecting strong operational performance. Conversely, a lower ROS may suggest inefficiencies in managing expenses relative to revenue.
However, in some contexts, Operating Profit (Operating Income or EBIT) is used in the calculation of ROS to assess a company's operational efficiency, excluding non-operating factors like taxes and interest. This version of ROS is often referred to as Operating Profit Margin.
Step-by-Step Instructions
1. Select Your Target(s)
Choose your company, a customer, a competitor, or a company you are considering investing in.
2. Gather the data
You want data for several years (or you can compare 2 or 3 companies).
Use the Visual Finance App OR locate an annual report for the company and open the Income Statement,
The annual report will show financial data for the reporting year and 1 or 2 years previous. Remember it may have a different name:
- Statement of Earnings
- Profit and Loss Statement (P&L)
- Statement of Profit and Loss
- Statement of Operations
- Statement of Comprehensive Income
3. Look at the Return on Sales for each year.
You can also find an ROS calculator at the Return On Sales entry in the Visual Finance Glossary.
4. Identify Key Factors:
Analyze the components that affect ROS, such as revenue growth, cost management, and expense control. If there is a dramatic change in the ROS ratio, you will need to look more closely at the Income Statement to identify what is driving the change.
- Look for any one-time events or unusual items that impacted the ROS.
- Events that are not part of regular operations will be detailed in Adjustments (line item(s) near the bottom of the Income Statement).
- You may find additional information in the Notes to the Financial Statements.
5. What is Your Analysis?
- Did the ROS increase or decrease? By how much?
- What might have contributed to this change (e.g., changes in revenue, cost of goods sold, operating expenses)?
6. Earn Bonus Points:
Use the Visual Finance App to quickly bring up one or more competitors for your selected company. Which company has the better ROS? Can you determine why?
This Return on Sales exercise drives deeper insights into a company's operational efficiency and profitability. Happy analyzing!
Final Thought
Structure gives you the layout.
Analysis gives you the story.
And once you start asking what changed—and why?
you’re not just reading the numbers—you’re thinking like a businessperson.
That’s it! Short, practical, and hopefully useful.
Continue the Learning
This post is part of our Continue the Learning series, where we share tools, perspectives, and real-world examples to help you build stronger business acumen.
See all posts in the Continue the Learning series →